arsenal
An LLM-powered analytics platform for around 60,000 telco tower sites.
- Problem
- HQ and 12 regional teams had to dig through spreadsheets to understand electricity use and billing across around 60,000 tower sites.
- Role and team
- Sole designer, from concept to pre-launch, with front-end and back-end engineers, 2 data scientists, a data engineer, QA and a PM.
- Outcome
- Pre-launch. The HQ team has confirmed the design works. There are no usage metrics yet.
- Timeline
- Oct 2025 – Oct 2026
Arsenal forecasts electricity consumption and billing for Telkomsel's Network team. Its users are an HQ team of 10+ people and 12 regional PICs. I was the only designer on the product and worked with the team from the first concept through to pre-launch.
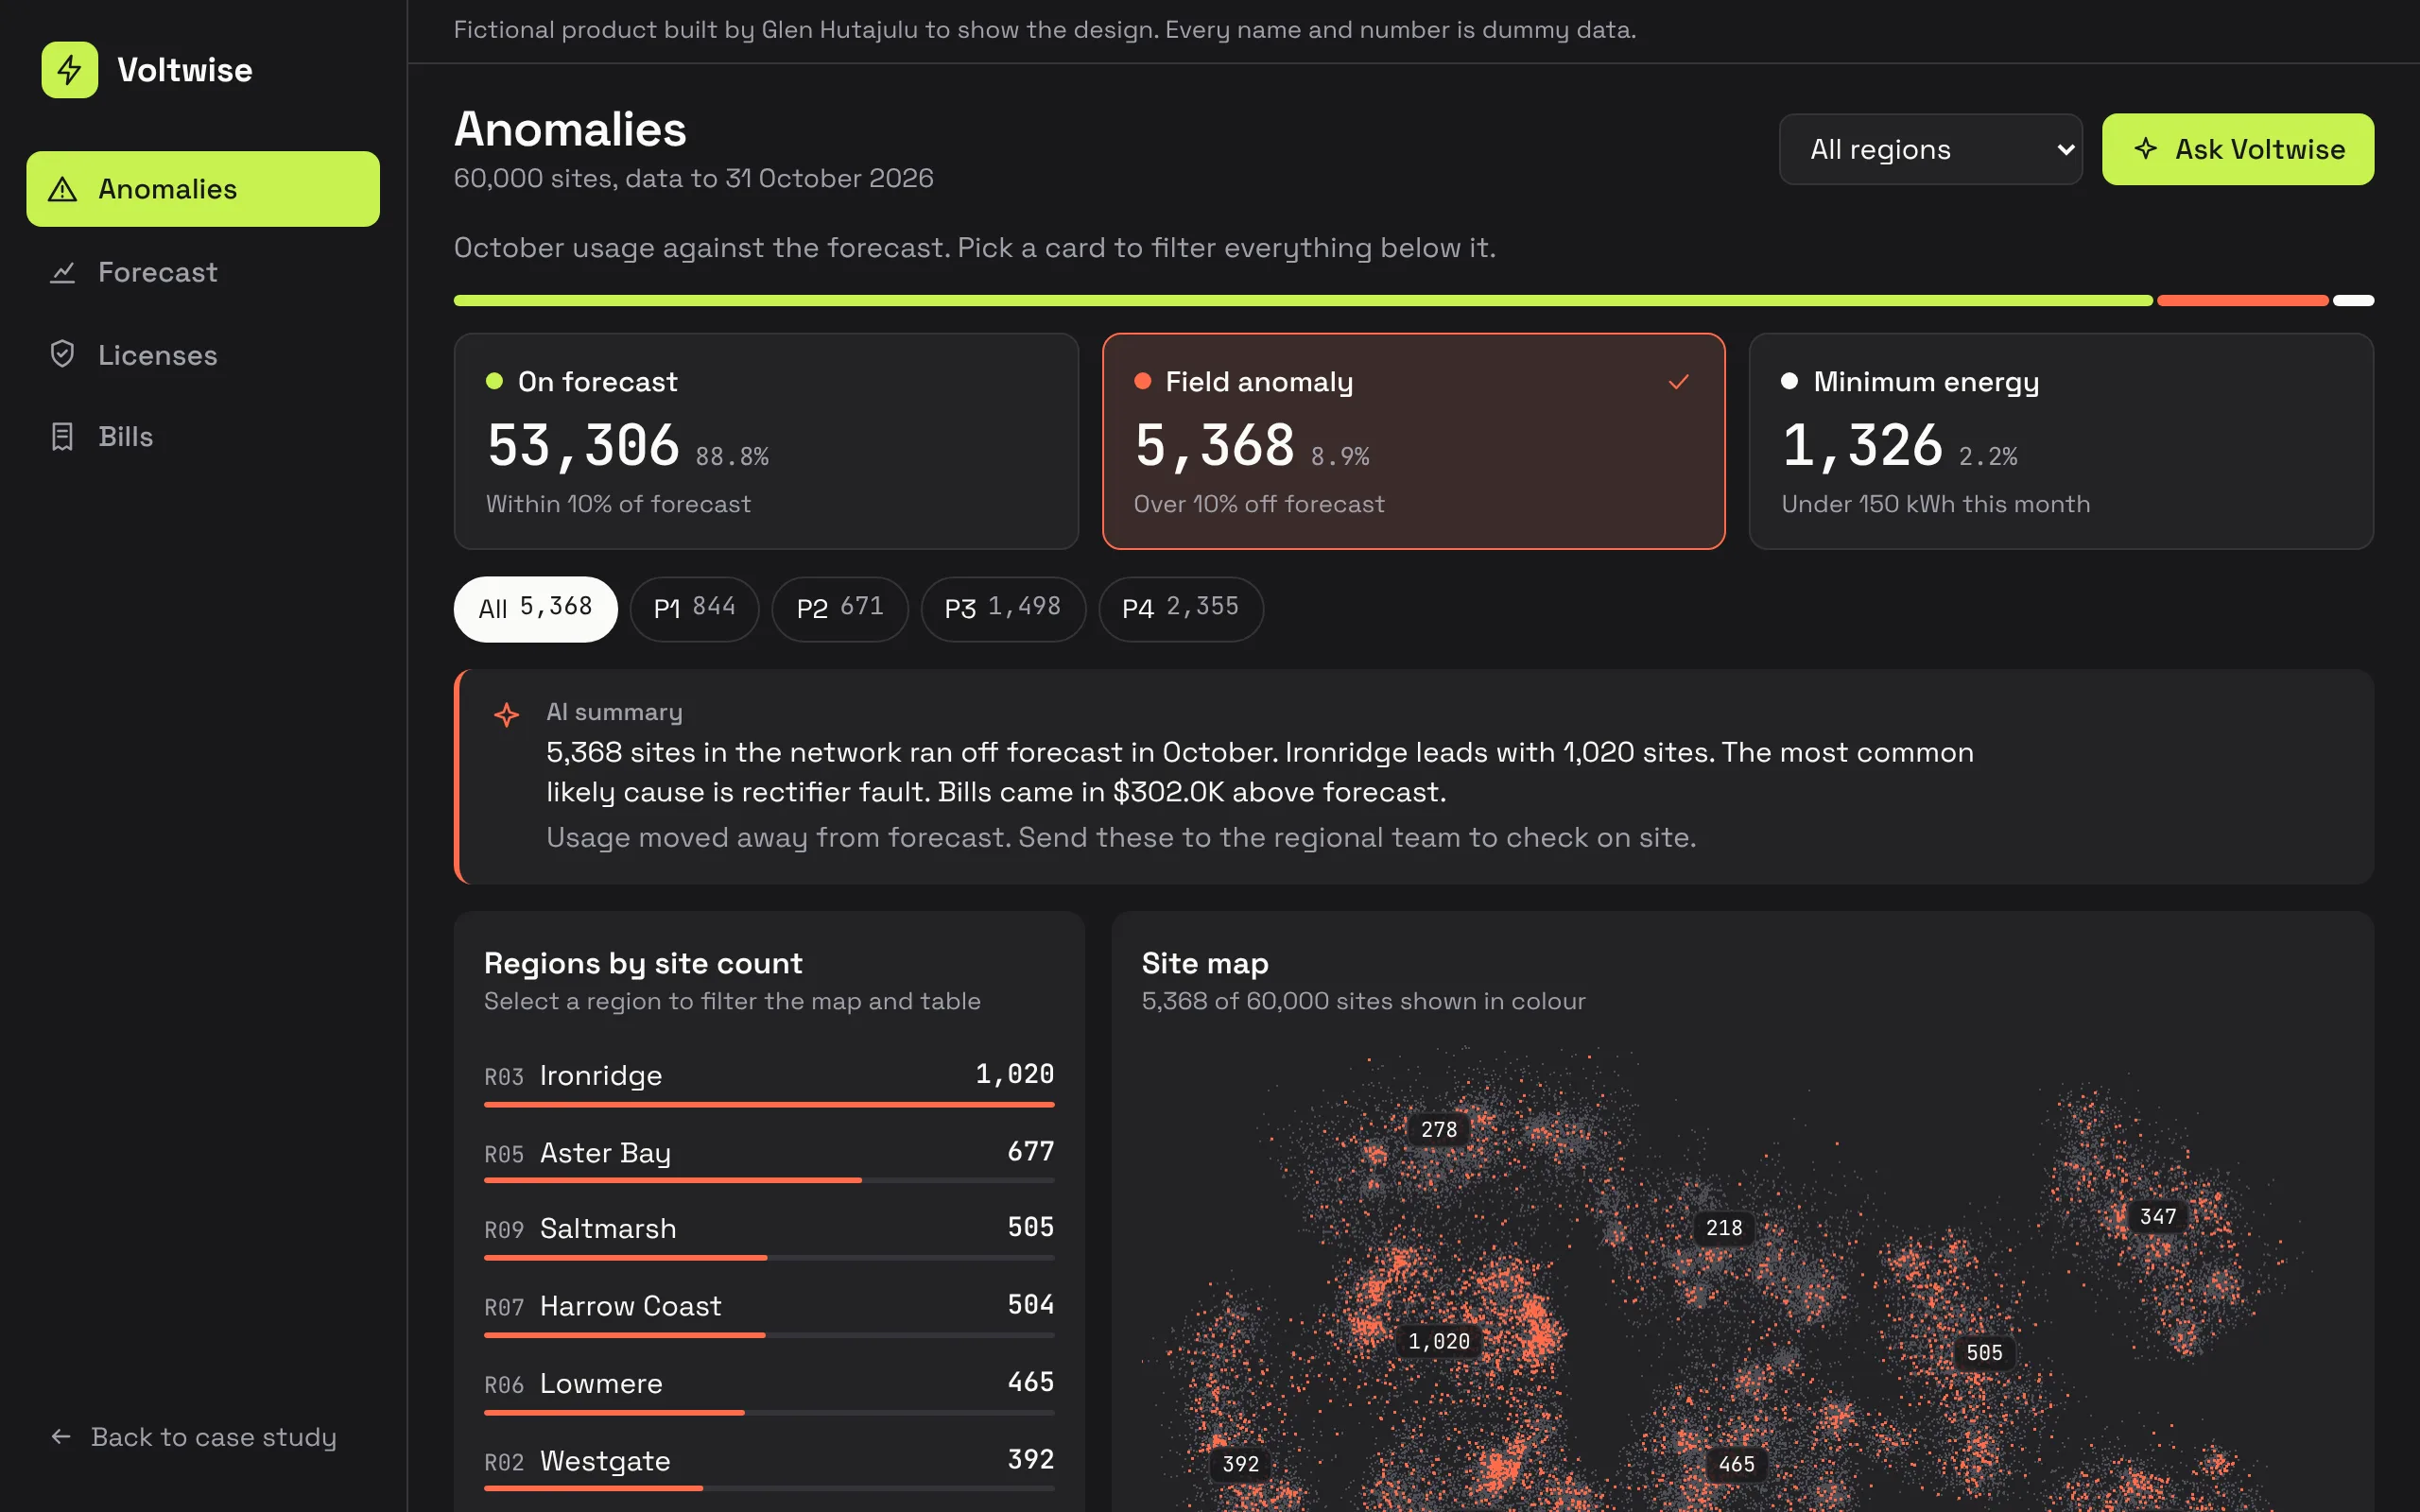
The screens on this page are from Voltwise, a working rebuild in code with a fictional brand and generated data. No real client data appears here.
turning a data problem into a reading problem
The underlying processing is complex: forecasts, metered usage, billing records and license records all meet at site level. Users do not need that complexity. They need to know which sites deserve attention and why. So the work was mostly about simplifying very complex data into visuals people can read quickly.
kpi cards that double as filters
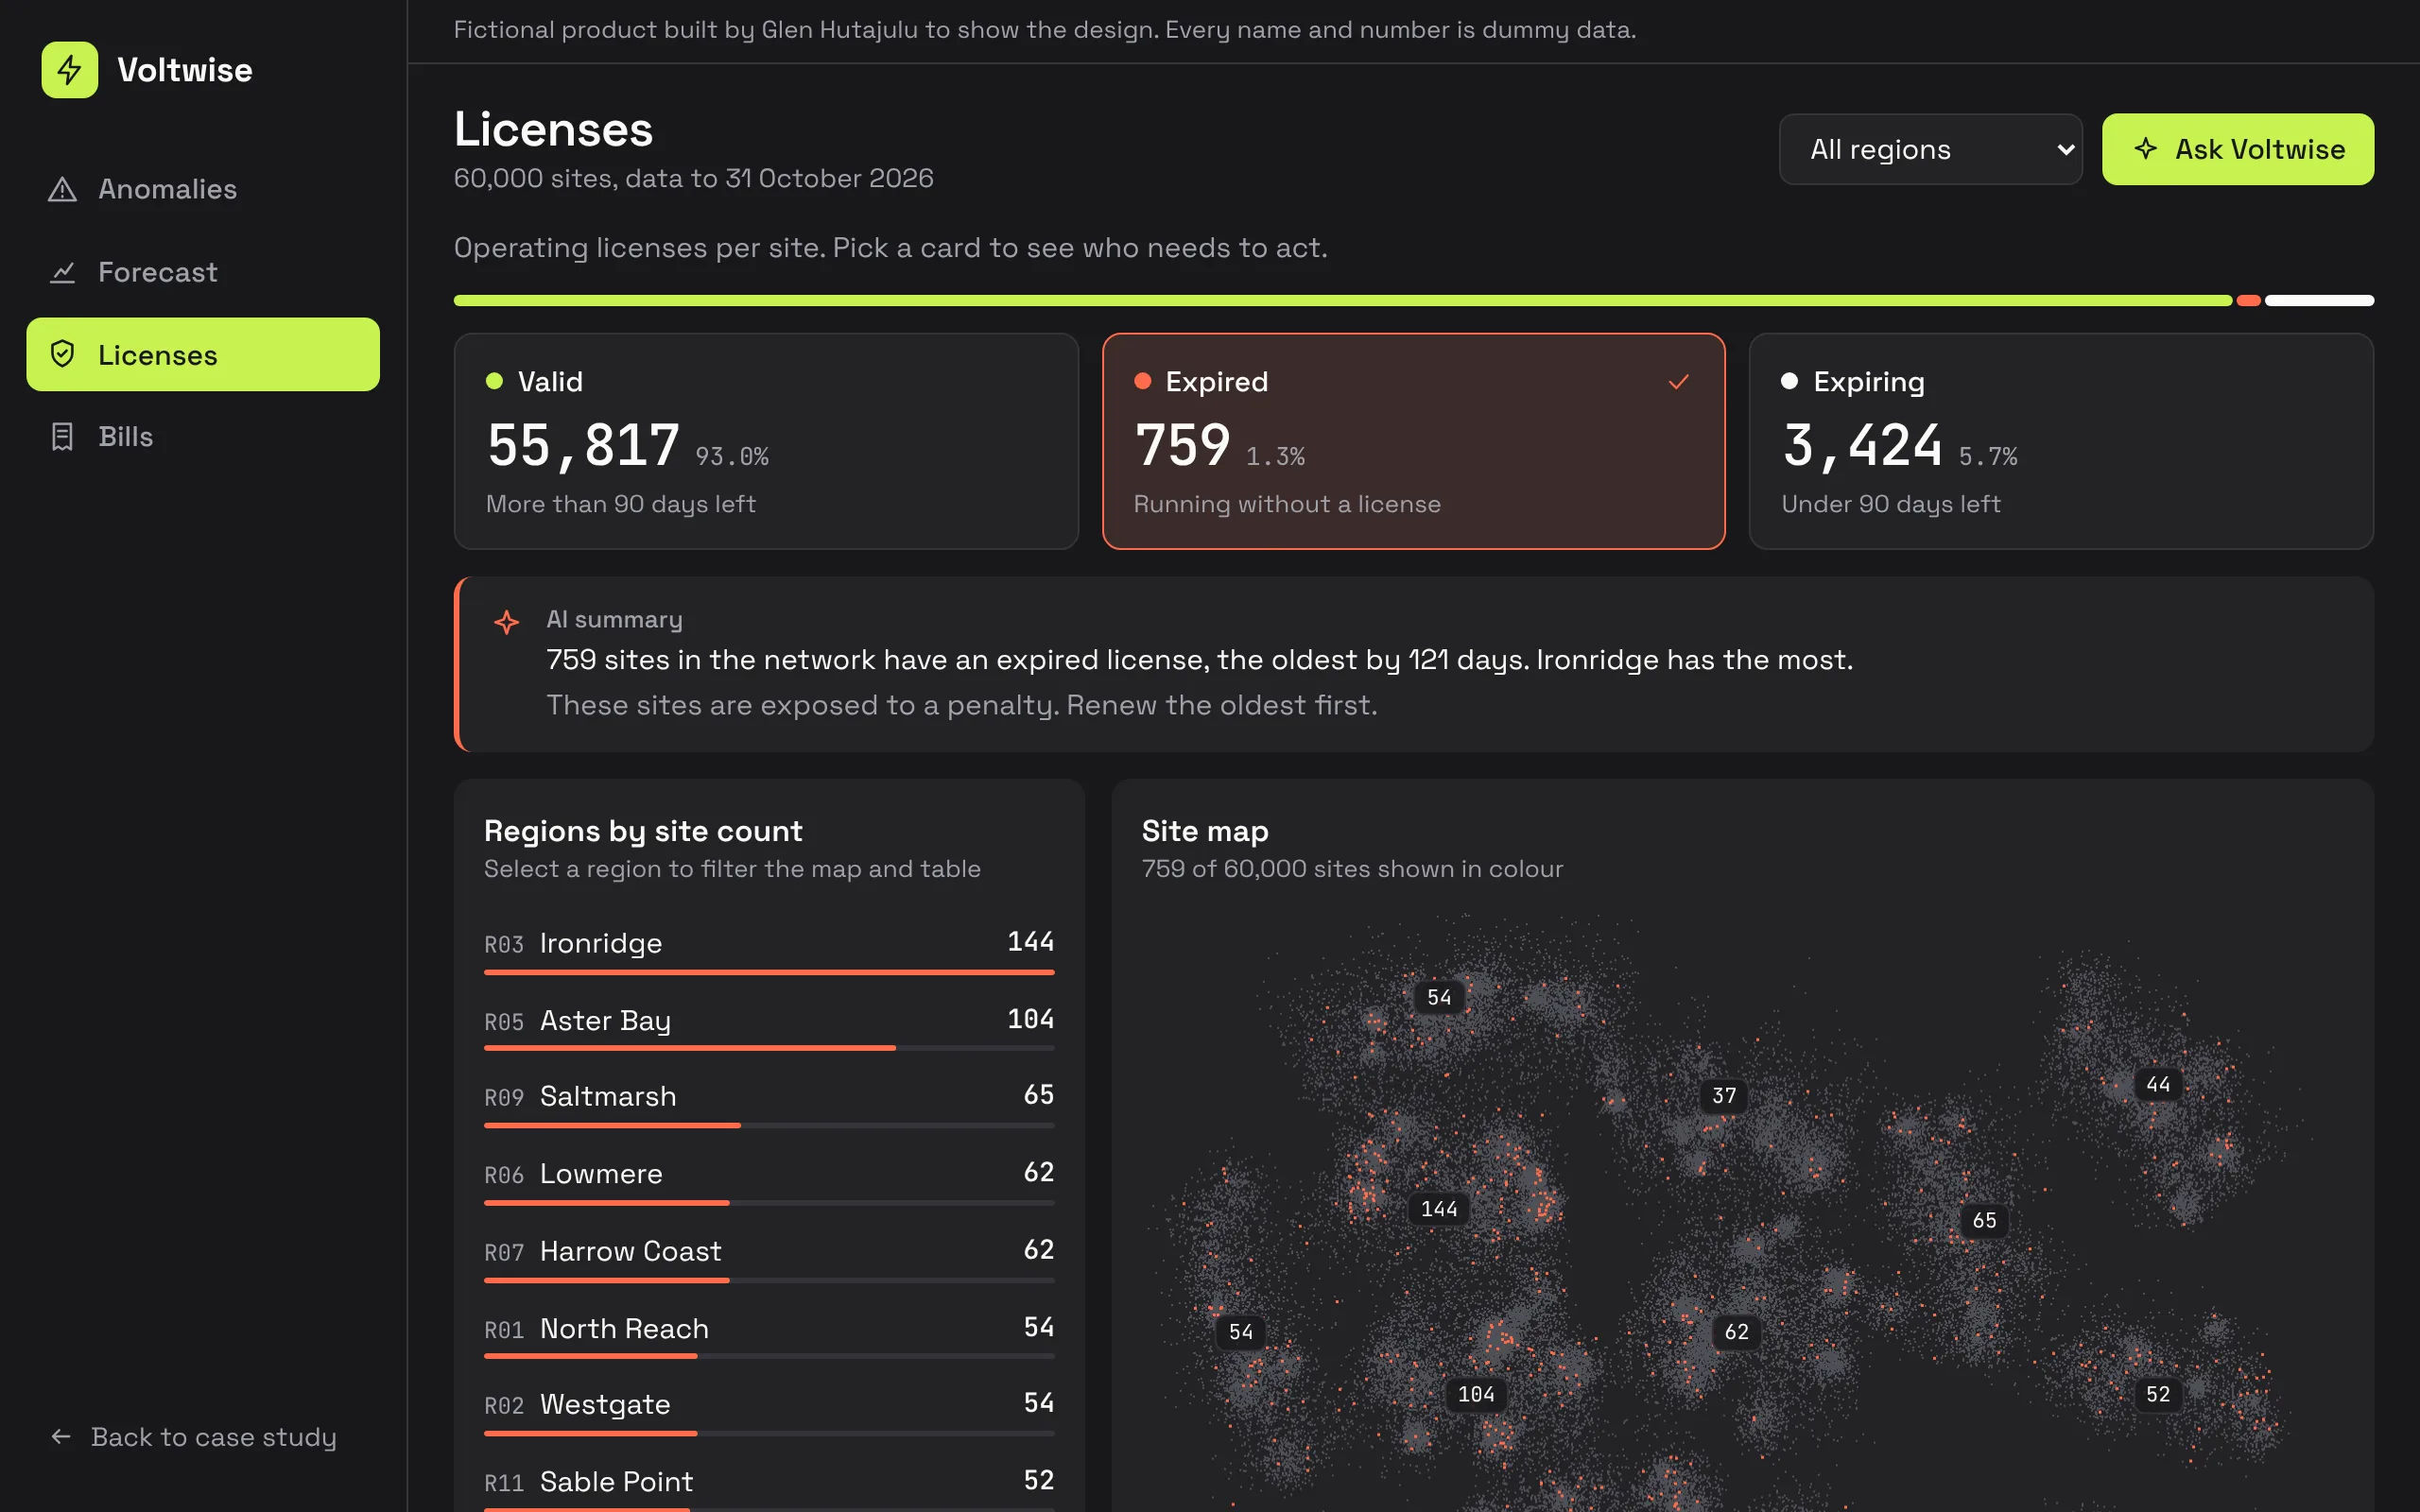
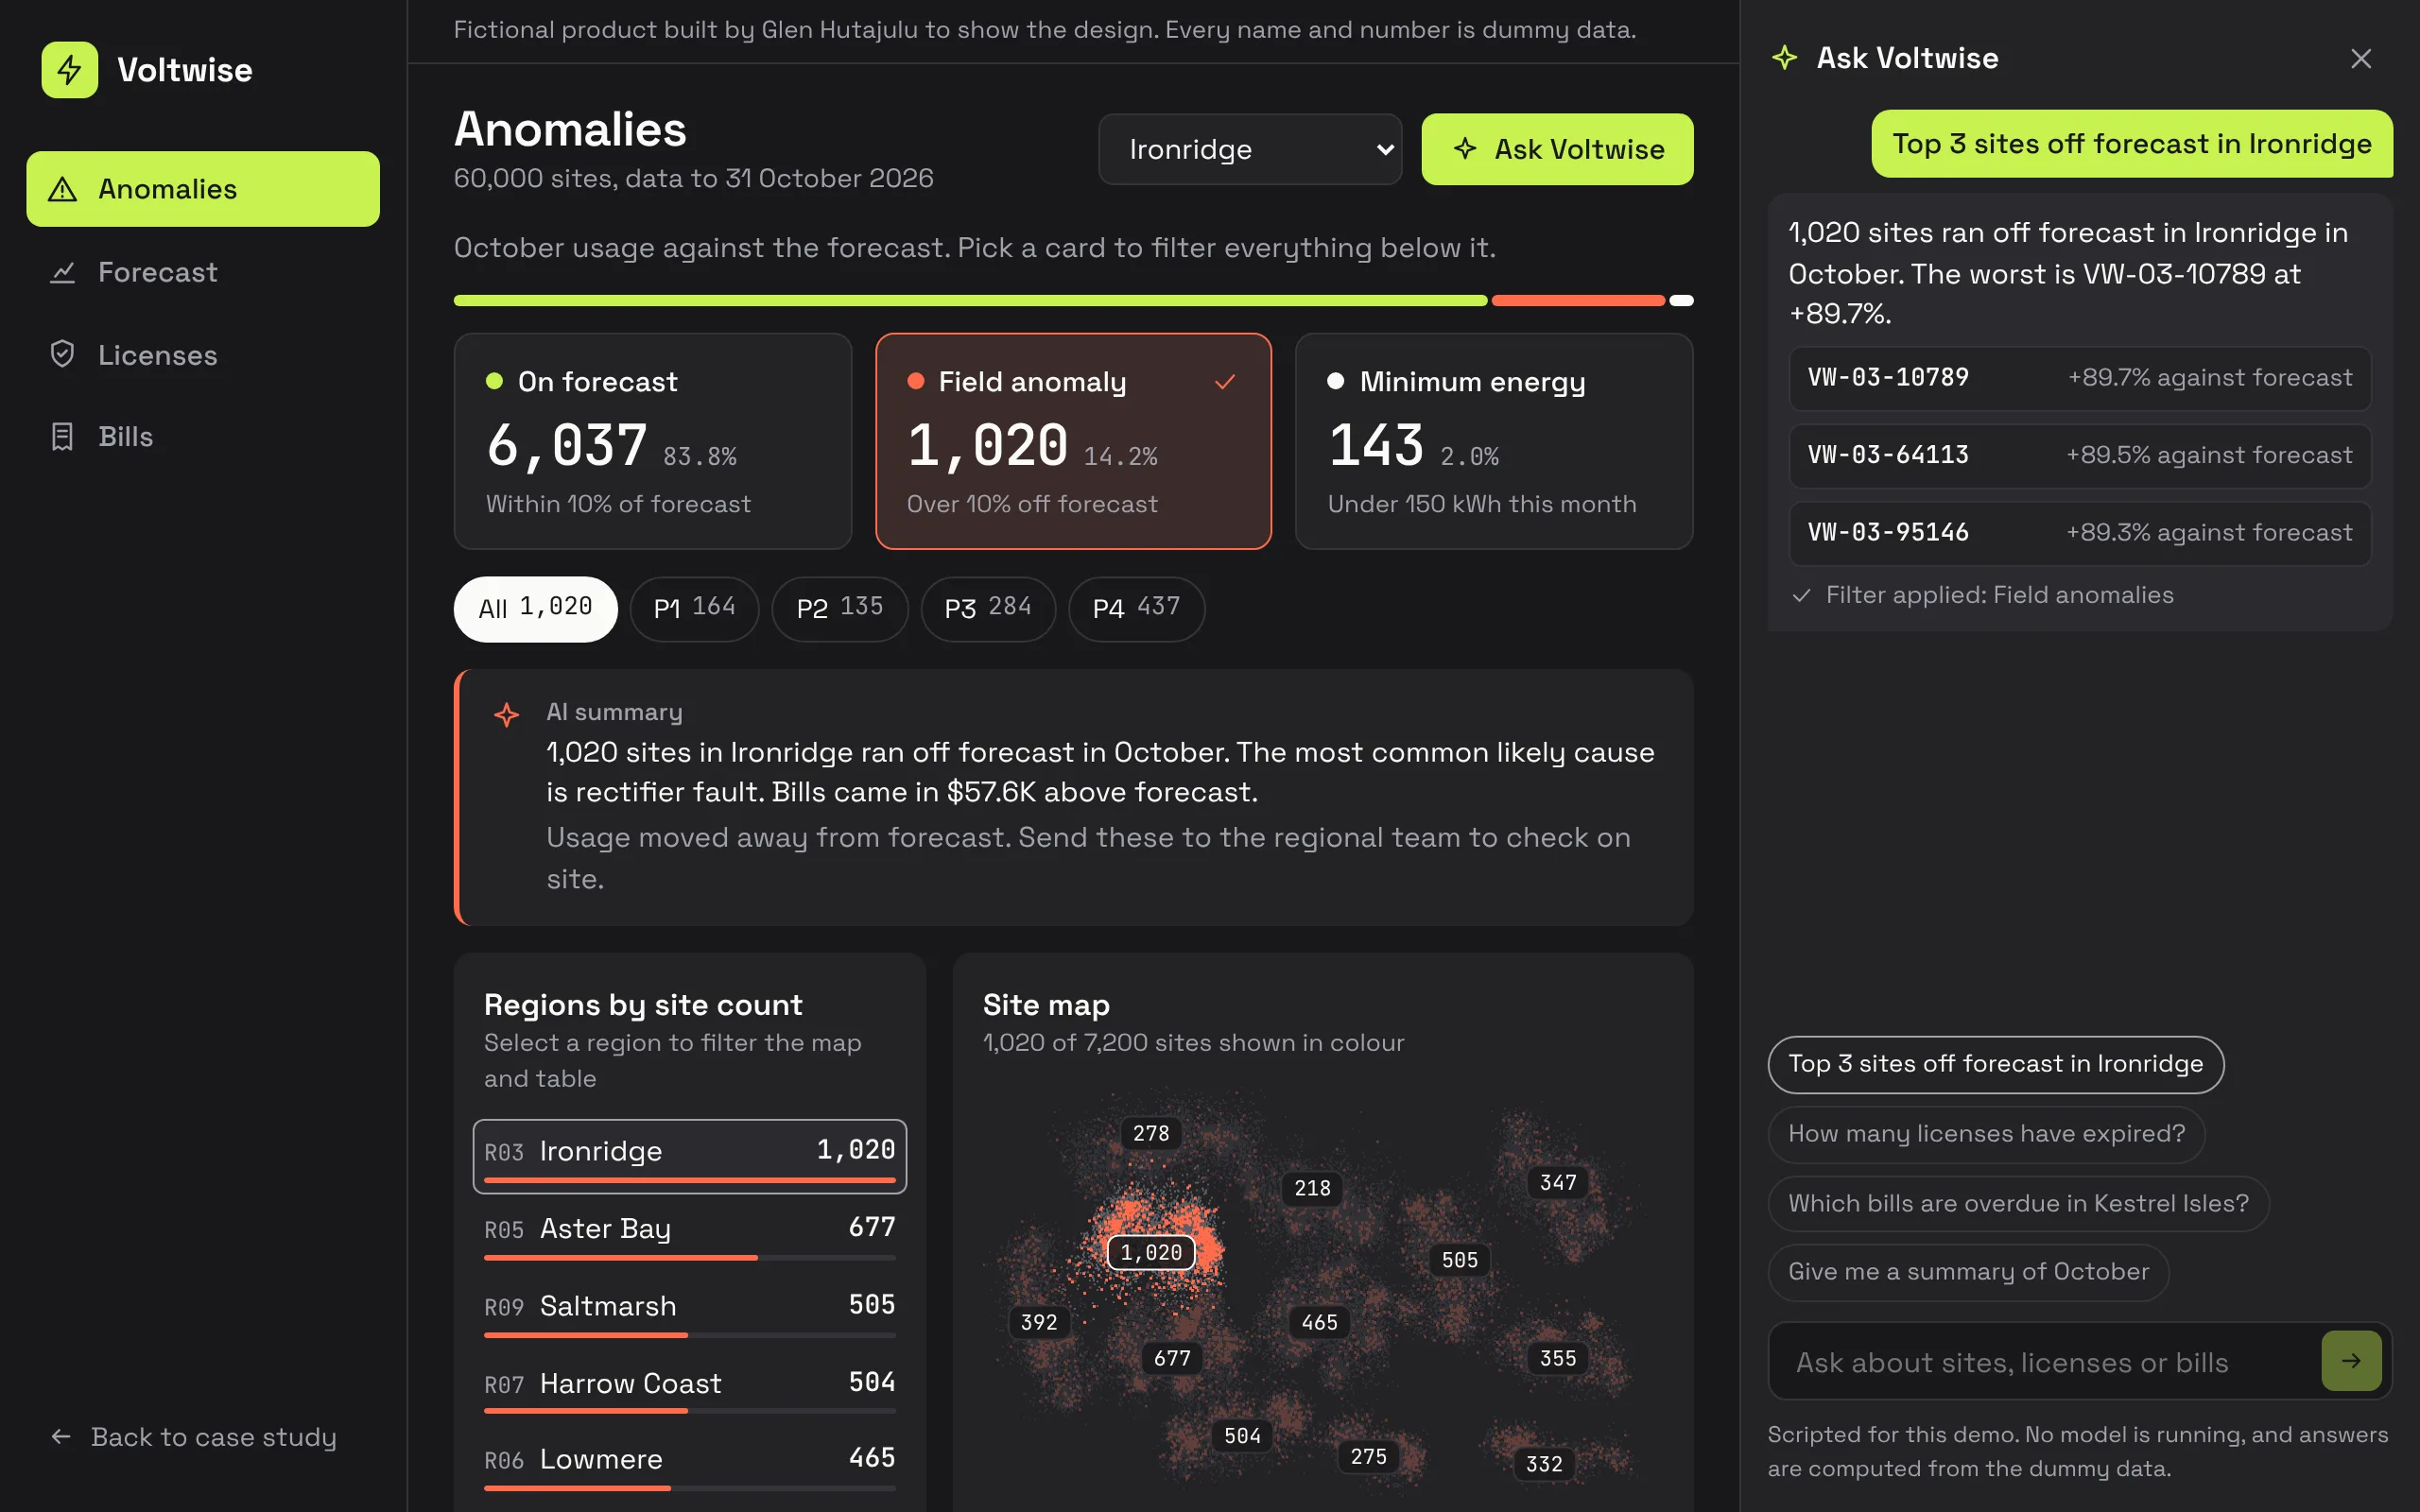
This is the signature pattern of the product. The KPI cards at the top of a view are also its main filter. Selecting one recolours the map, re-ranks the regions, rewrites the summary and narrows the table. A user reads a number and then acts on that same number, with no separate filter panel to learn.
one anatomy for every use case
Energy anomalies, license validation and invoice monitoring are different problems with the same shape: a population of sites split into states, where someone has to find the ones that need action. I used one structure for all of them: status mix, filter cards, ranked regions, map, explanation, table.
Two of those views track license adherence per site and upcoming bill due dates. They were built to cut avoidable utility costs and late payments.
a number needs its denominator
I considered leading the KPI row with absolute counts and rejected it. A raw count with no total in view sends the reader off to find the denominator before they can tell whether the number is good or bad.
So I set one rule that any future KPI can follow. A rate answers how well something is going, so it headlines as a percentage, with the count as a caption. A volume answers how much work is waiting, so it headlines as a count.
Units got the same care. On one screen, M meant billions on a network total and millions on a single site, so one site looked bigger than the whole network. I spelled the units out, and rounded percentages to whole numbers on summary pages. Decimals belong on the detail page.
eight versions of one summary page
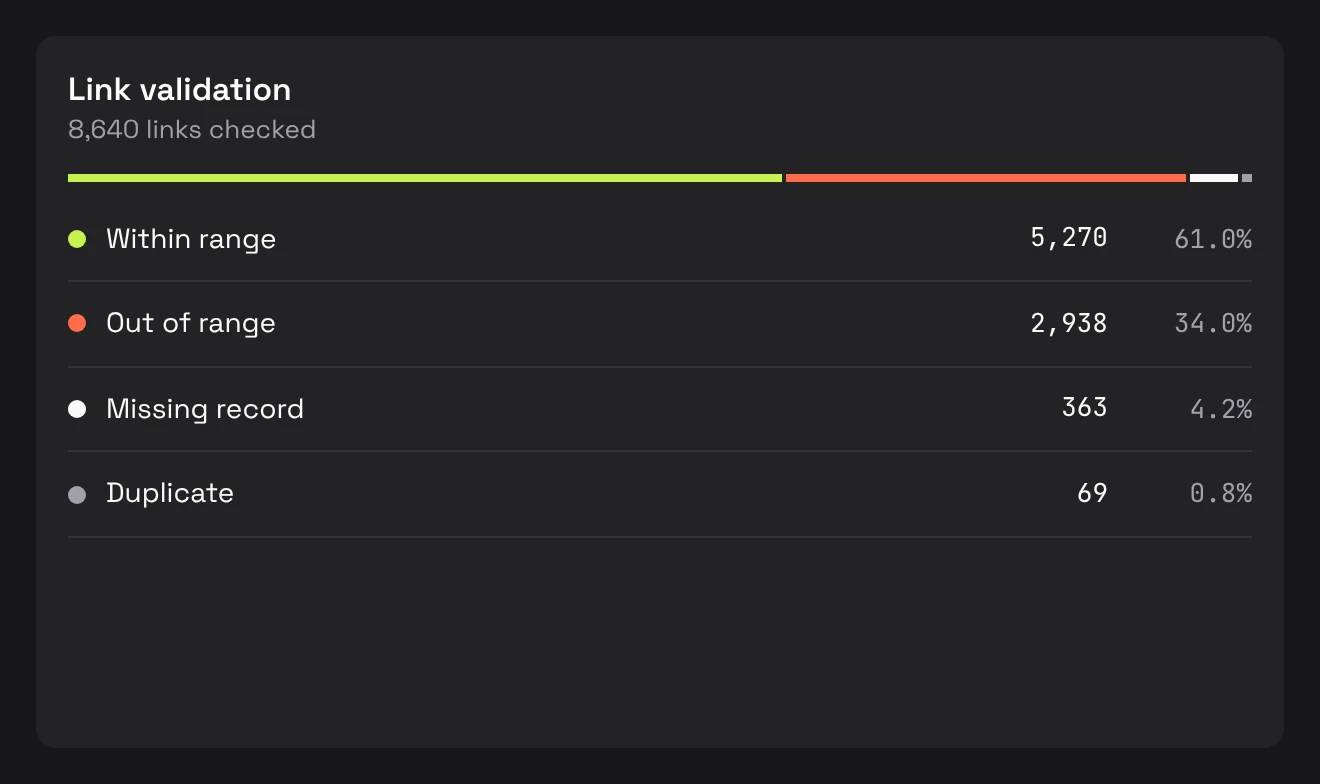
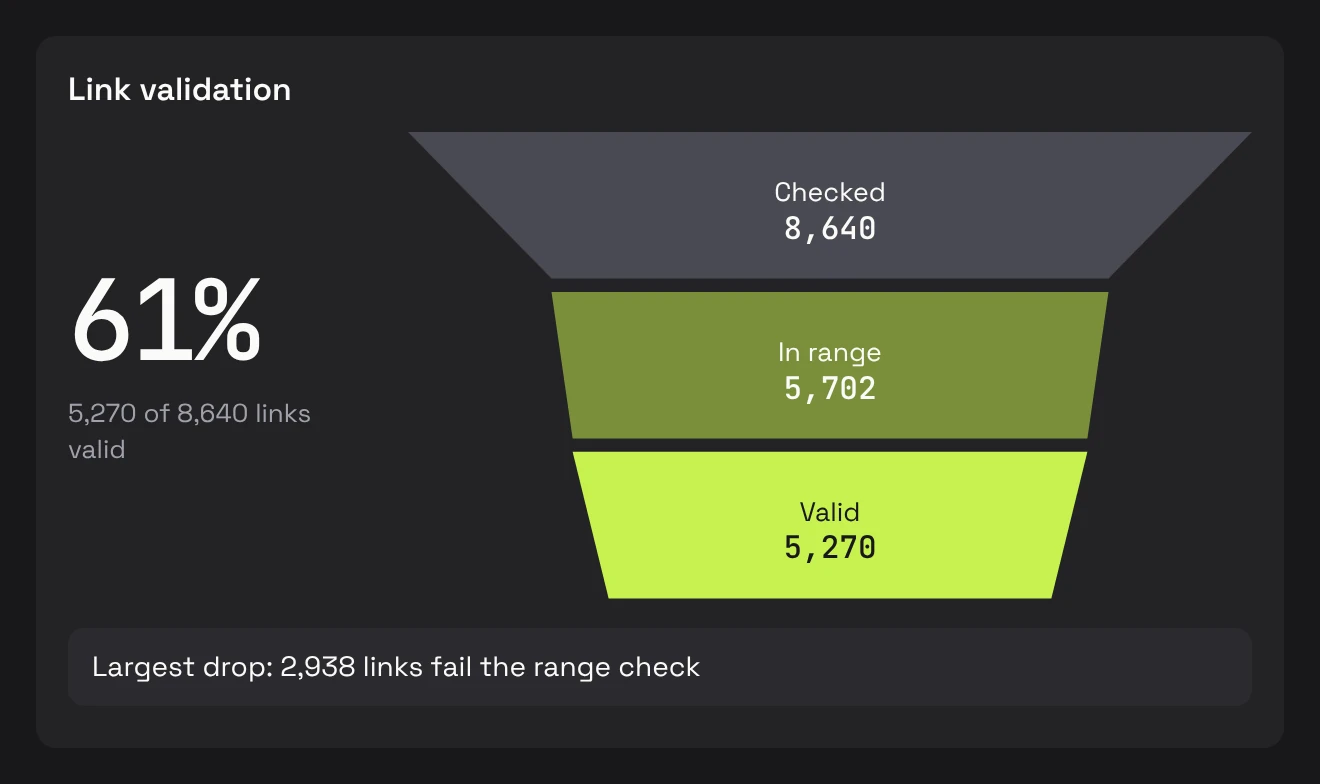
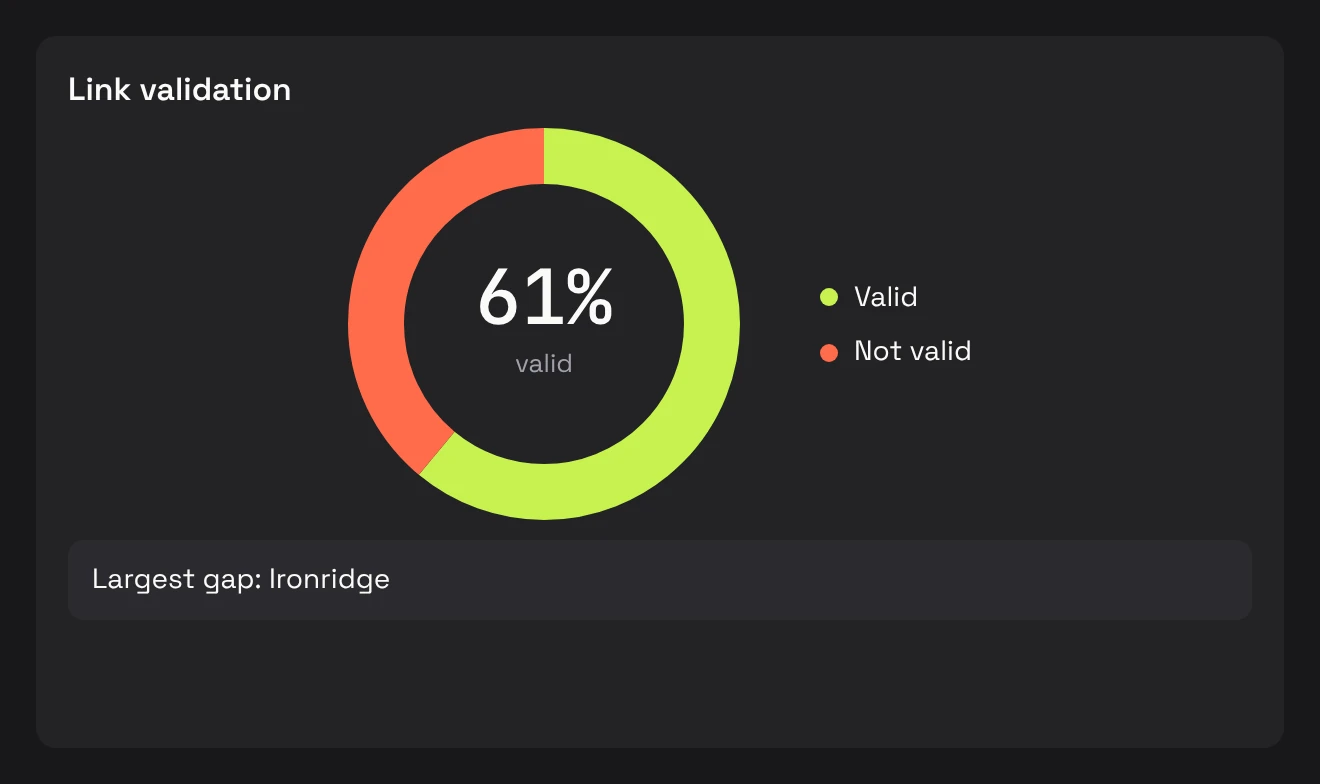
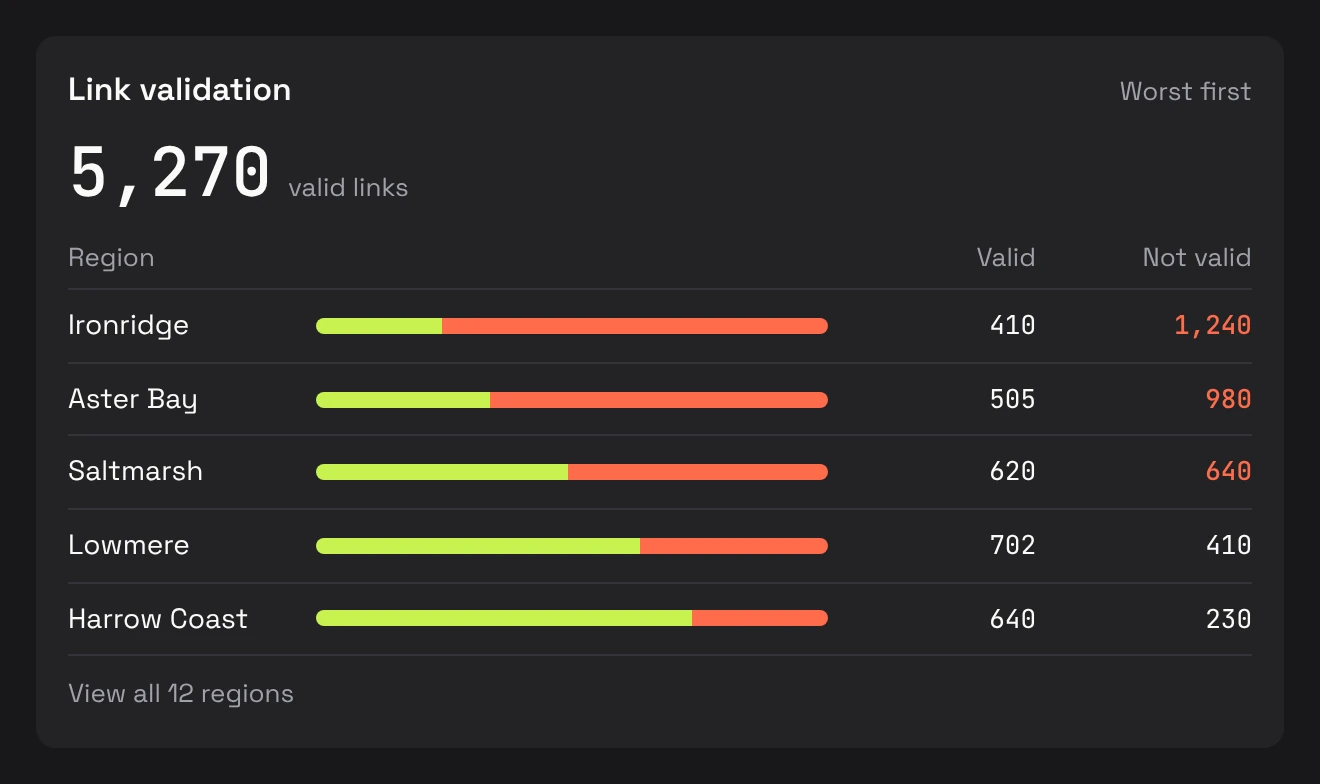
I designed an executive summary one level above the detailed settlement page. It took eight versions, and these four turns shaped it. The panels are recreations with fictional data.
Turn 01
a list posing as a chart
One number and one chart replaced the list.
Turn 02
tabs that hid the answer
One list keeps all three metrics in view.
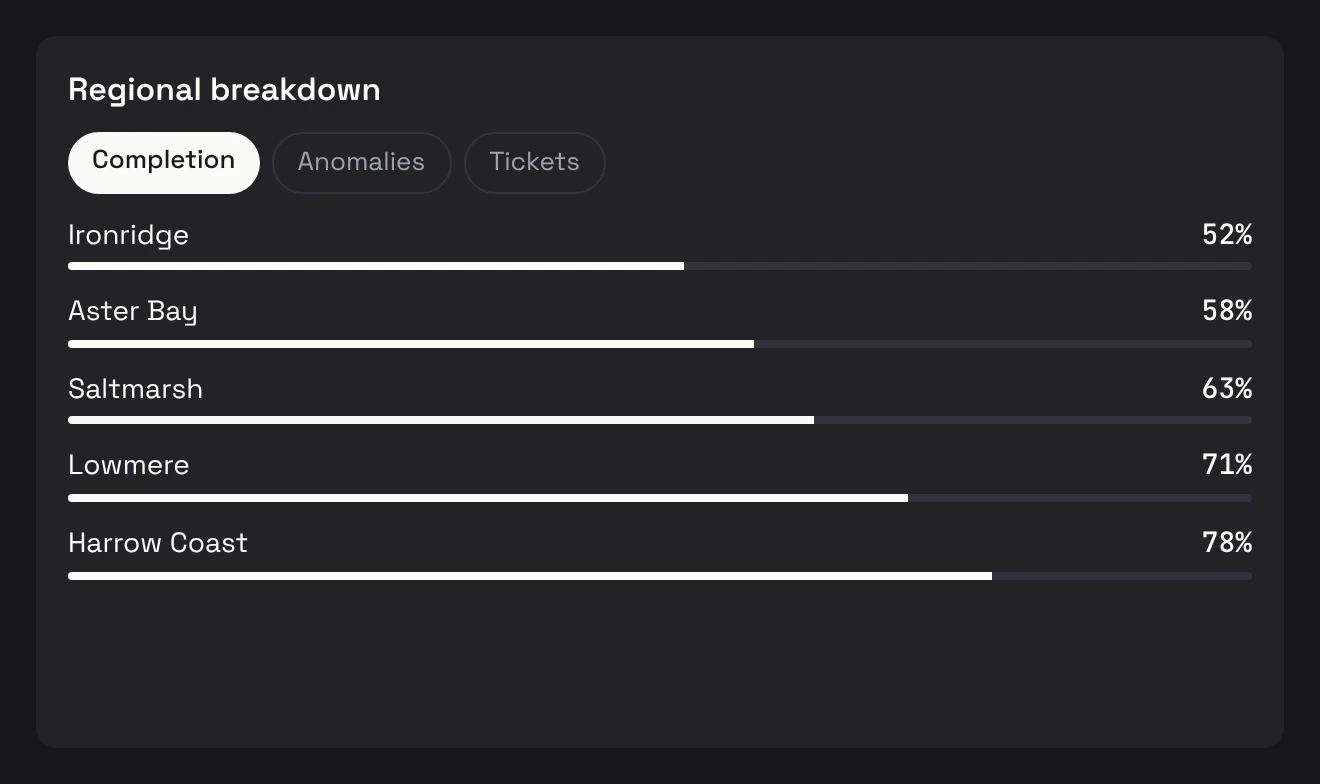
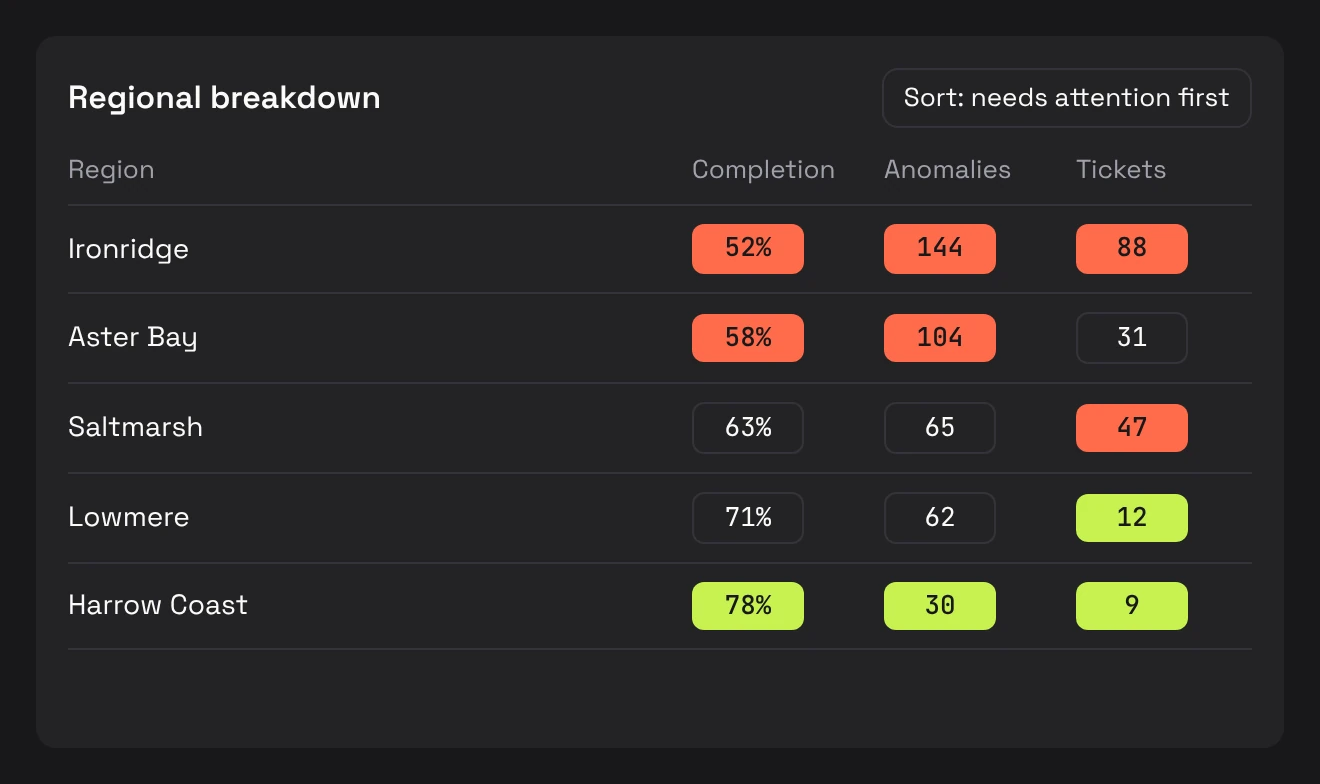
Turn 03
two cards, two stories
One list, with National as the first row.
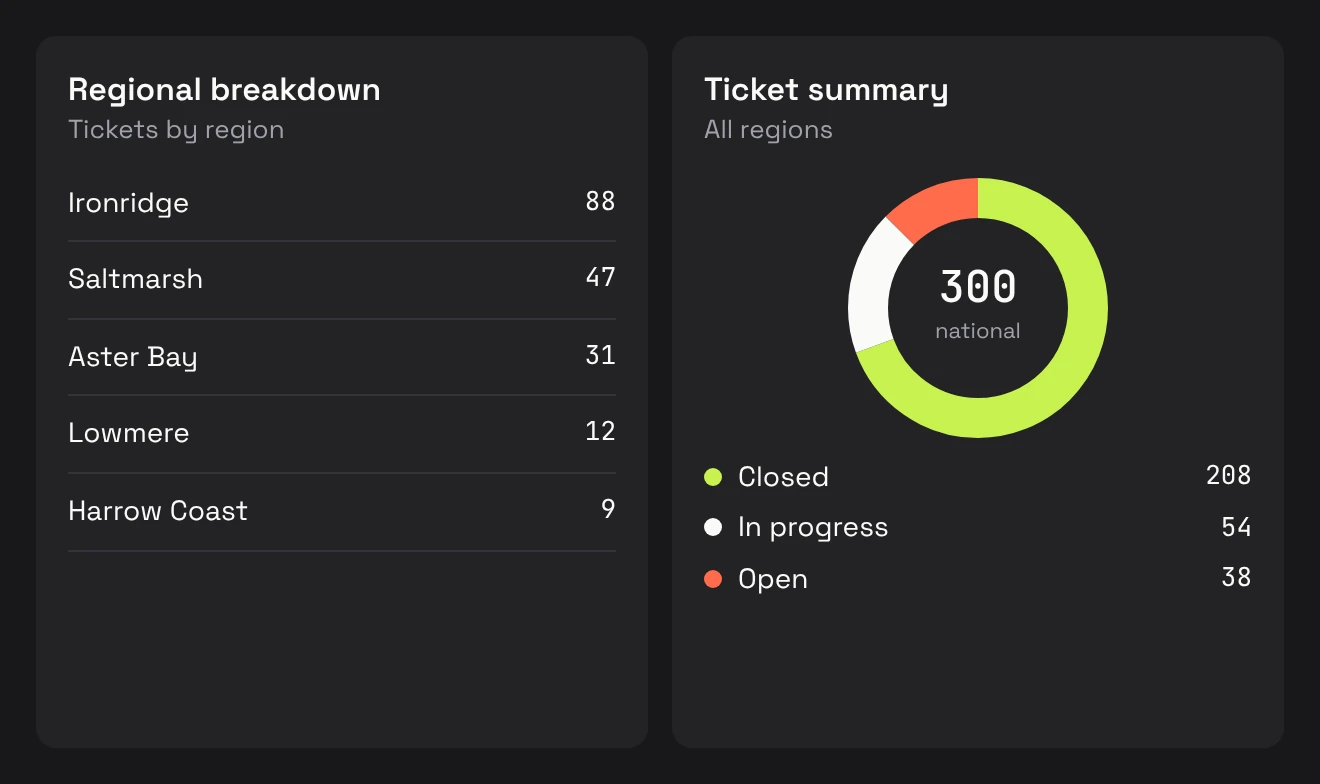
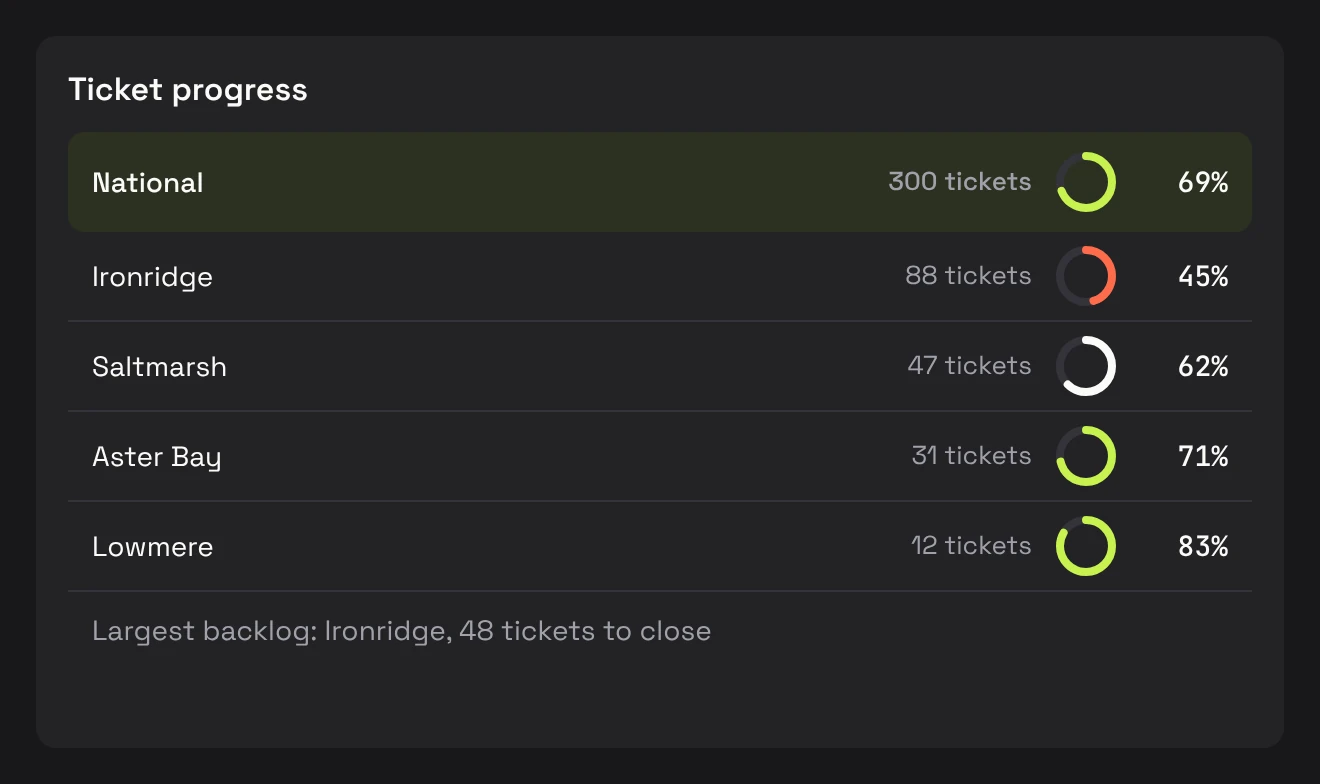
Turn 04
management rewrote my rule
They wanted plain counts per region, so I followed them and kept the worst regions on top.
two ticket models on one page
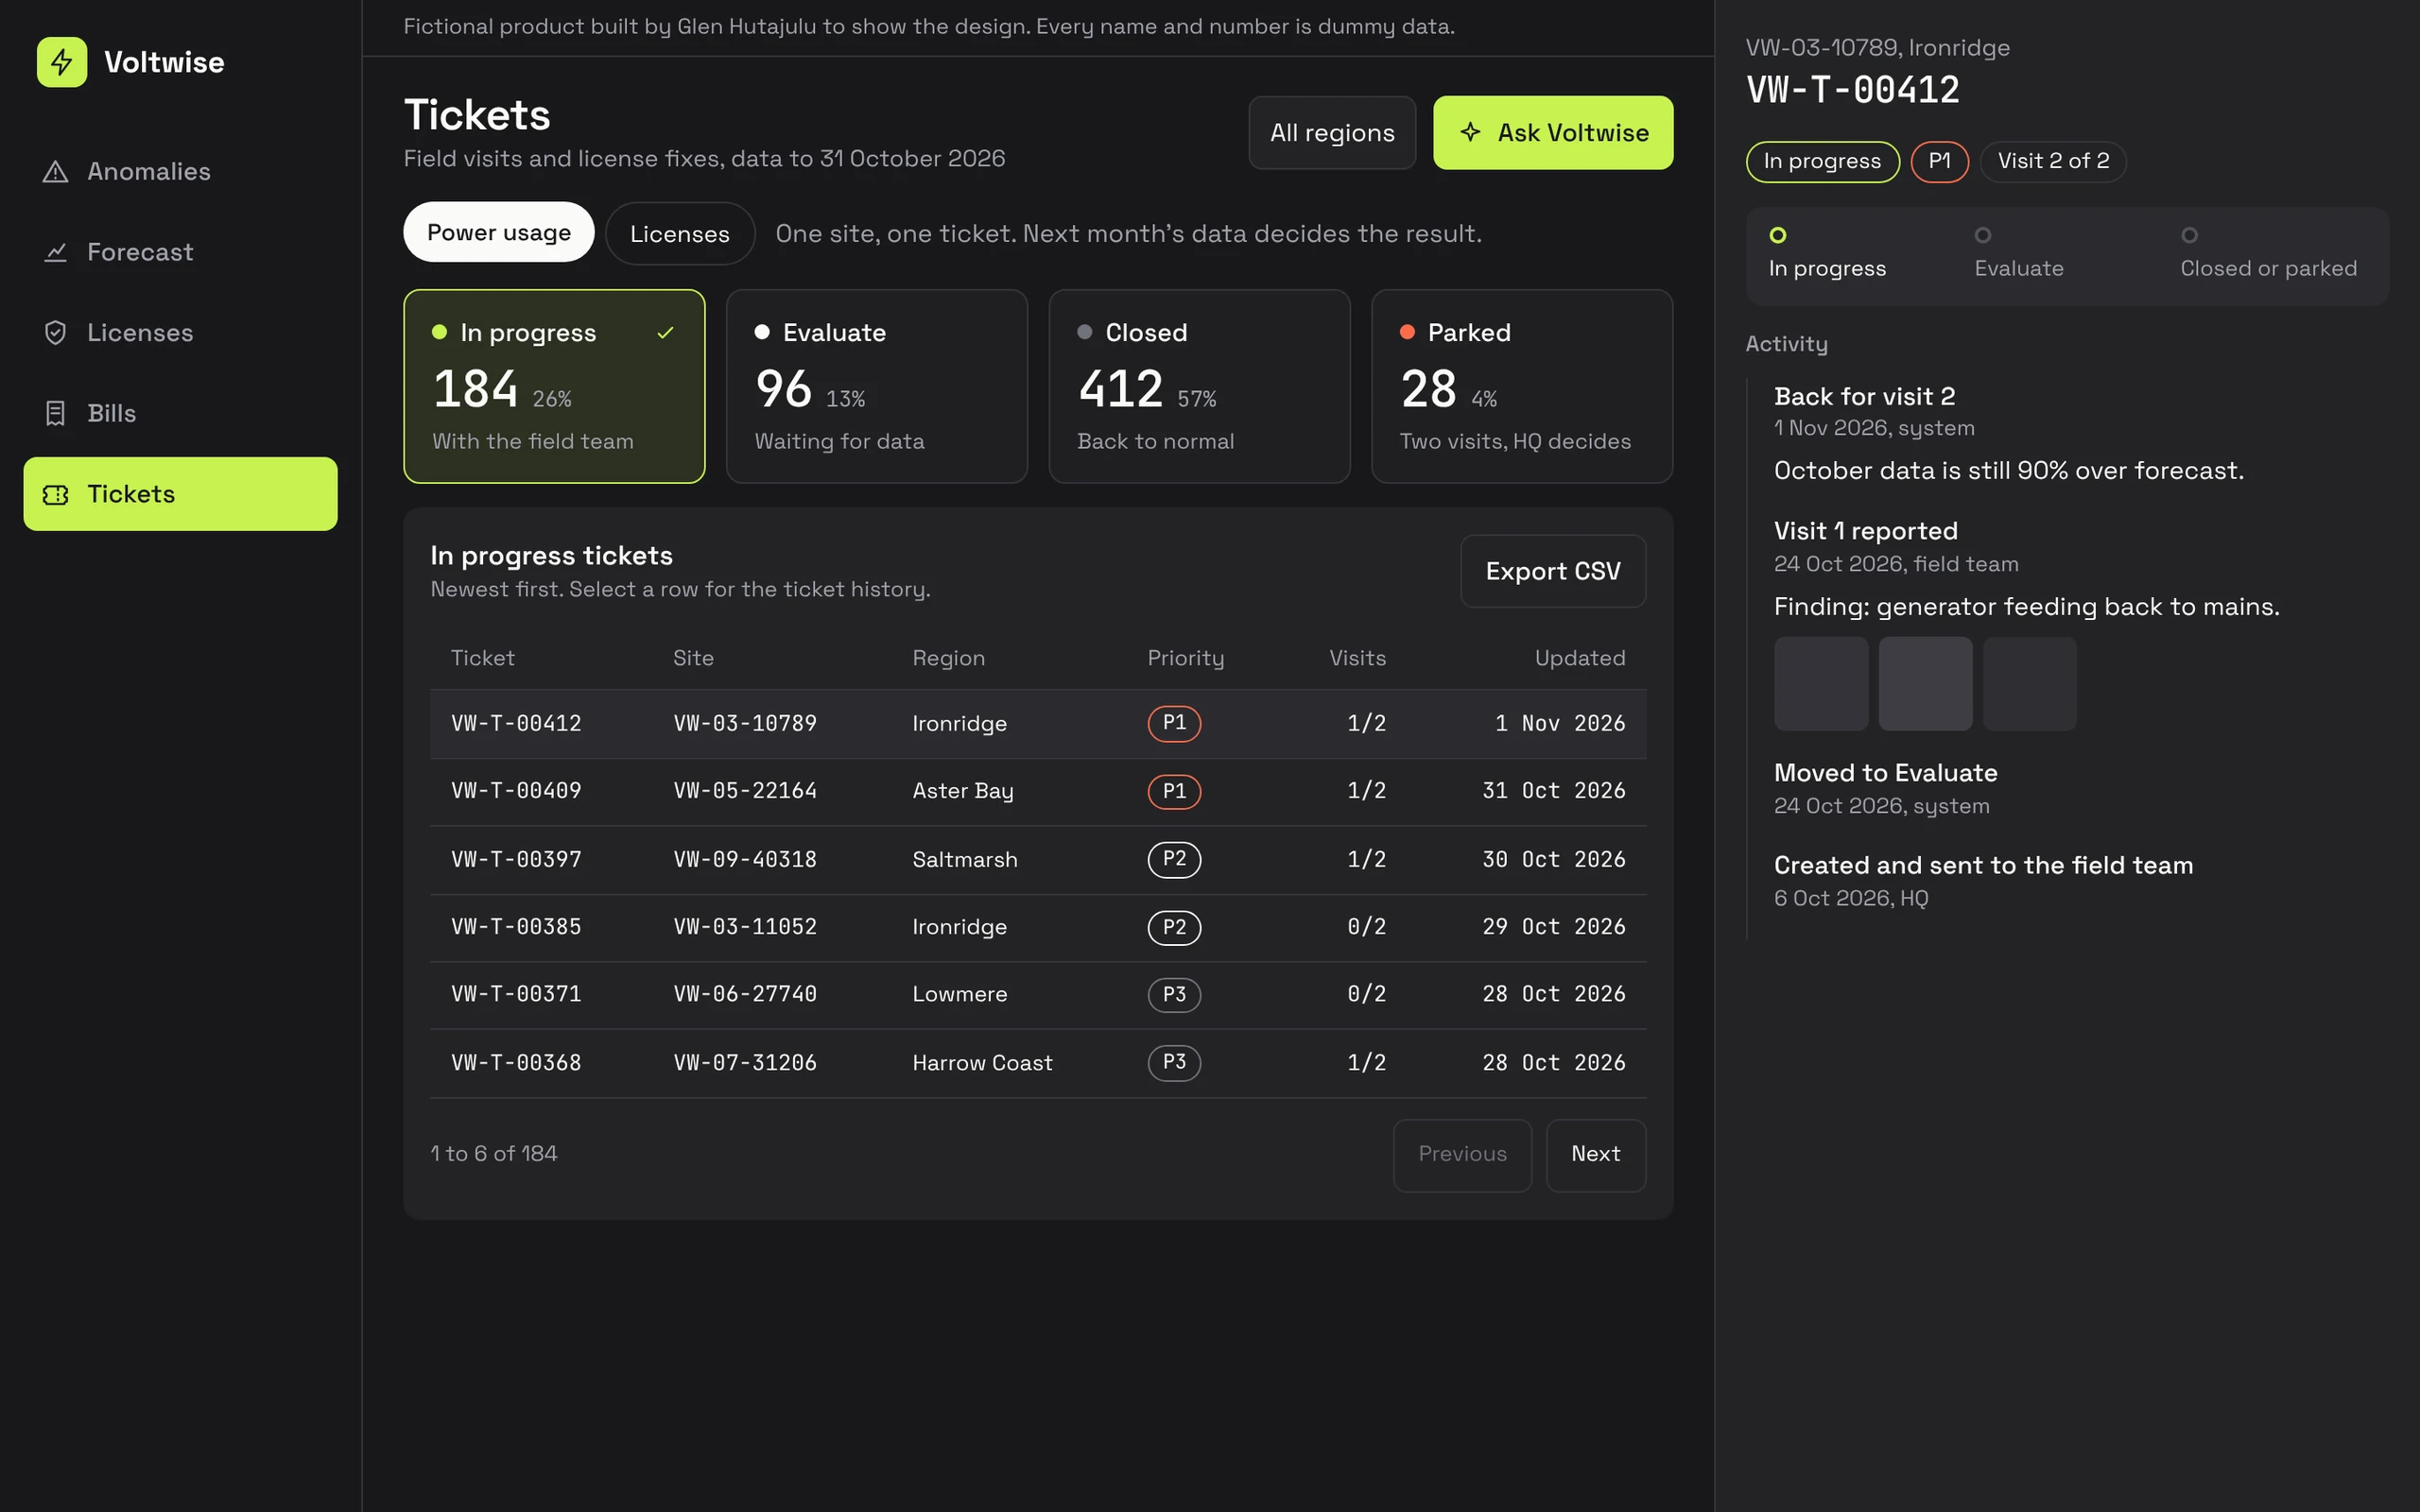
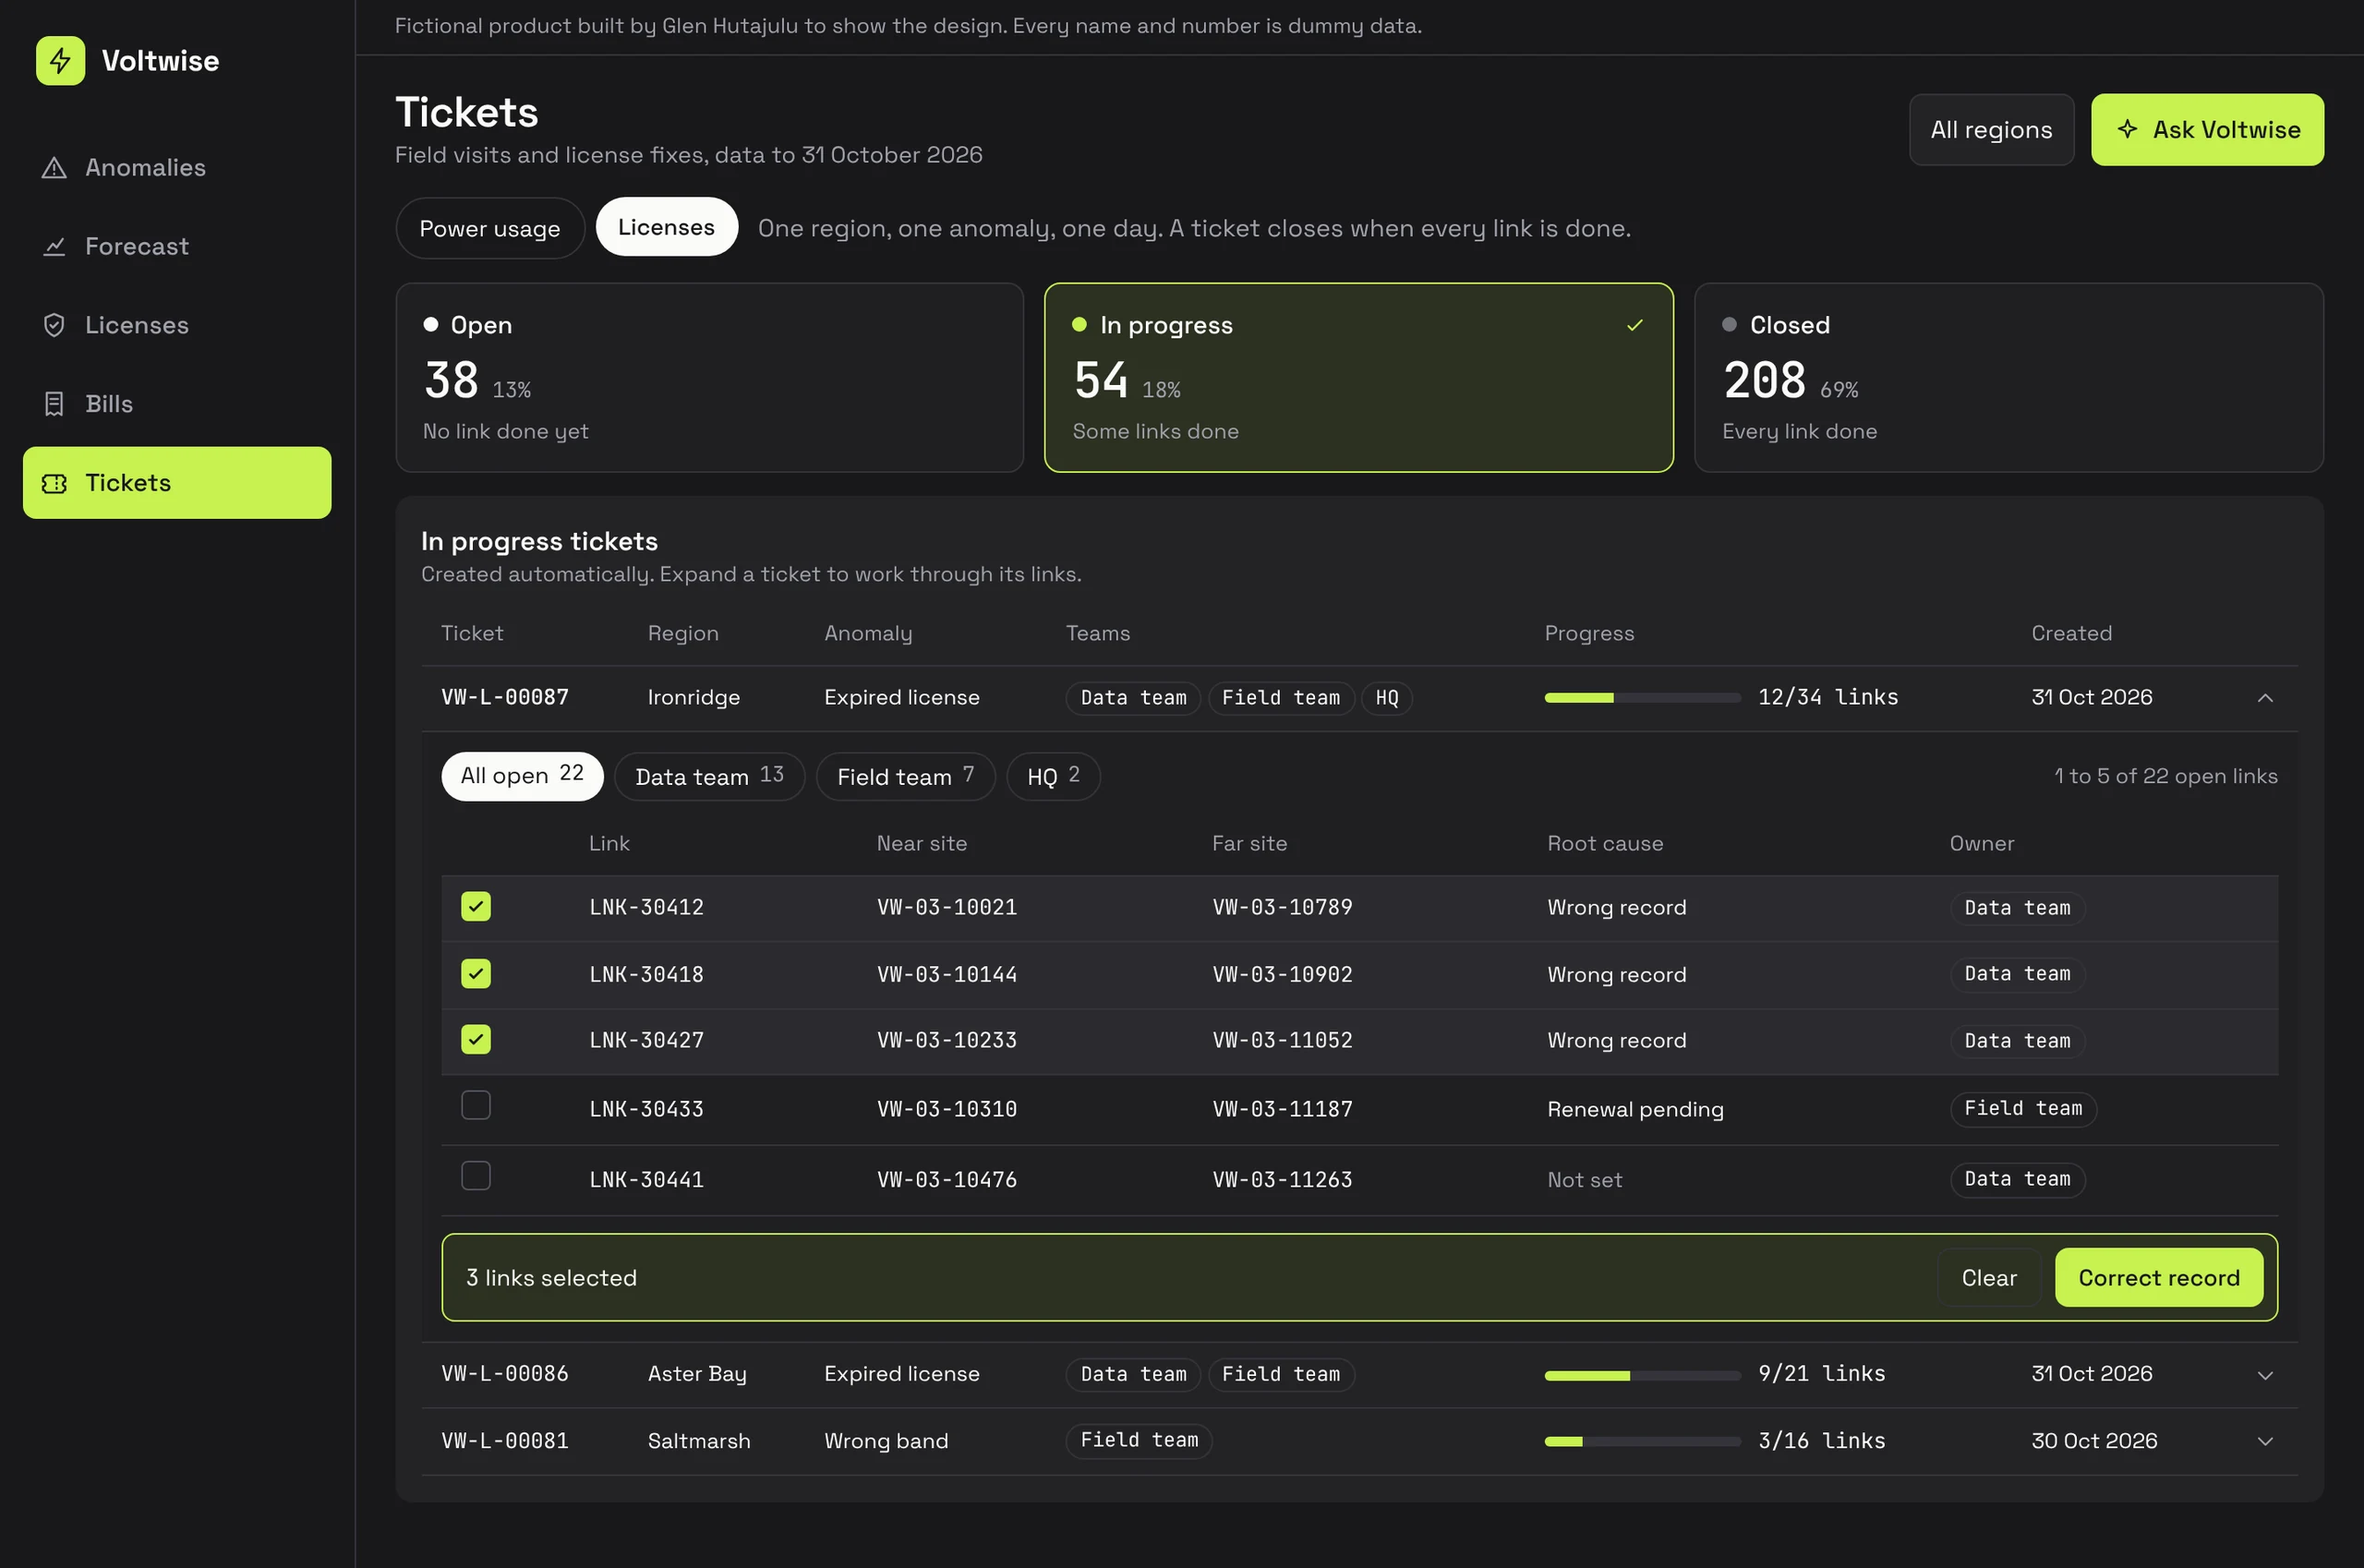
Arsenal has to start work that happens somewhere else. Findings turn into tickets on one Alert & Ticketing page, with a tab per use case and status cards that filter the table. Behind the tabs, the two ticket types work differently, because the work does.
power usage: one site, one ticket
HQ creates tickets where the problem is found: from the anomaly contributor list for a whole area, or from one site's analysis page. A confirmation shows how many tickets will go out, because sent tickets cannot be cancelled. Sites that do not qualify are skipped automatically.
Tickets go straight to the field team's own system, so Arsenal monitors the work rather than rebuilding it. A stepper shows where each ticket is, the activity log holds the visit report and photos, and the next month's data decides the result. A ticket closes only when the site is back to normal, and the reason is recorded. After two visits without a fix it parks, and only HQ can reopen it, with a reason. Regional users follow their own region's tickets but cannot create any.
In progress → Evaluate → Closed or Parked
license settlement: one region, one anomaly, one day
Here the system creates tickets automatically, and one ticket can hold many links. Each covers one region, one anomaly type and one day, shows progress by link, and closes itself when every link is done.
This work stays inside Arsenal and crosses teams. Each anomaly goes to the team that owns it. One team sets the root cause and corrects the data, and HQ approves the change. Another fixes the issue outside Arsenal and marks it resolved. So a ticket row expands into its links, and links can be selected and handled in bulk.
Open → In progress → Closed
designing around the integration
I designed power usage ticketing twice. Plan A sends tickets to the field system through an API. Plan B runs inside Arsenal, with Telegram for field updates, and keeps a point where it could later move to the API without changing the experience. Plan A became the version ready for development.
from kilowatt-hours to hours of backup
Power Backup Optimization finds sites short of backup power and recommends a fix. It first measured this as a coverage percentage, which was too vague. I replaced it with backup autonomy: how many hours a site can run at peak load, against one fixed target.
Hours now come first and kilowatt-hours second. The number also splits into battery and genset, because each has a different fix. A nearby donor site can share battery capacity, but a genset shortfall needs its own capacity action. When a donor only closes part of the gap, the recommendation shows an interim step and a permanent one.
Healthy sites stay quiet: no recommendation, no work order button, and a dash for revenue at risk instead of zero. On the map, each status has its own colour and shape, so it does not rely on colour alone, and clusters keep their dominant status instead of all turning red.
an ai layer that sits inside the work
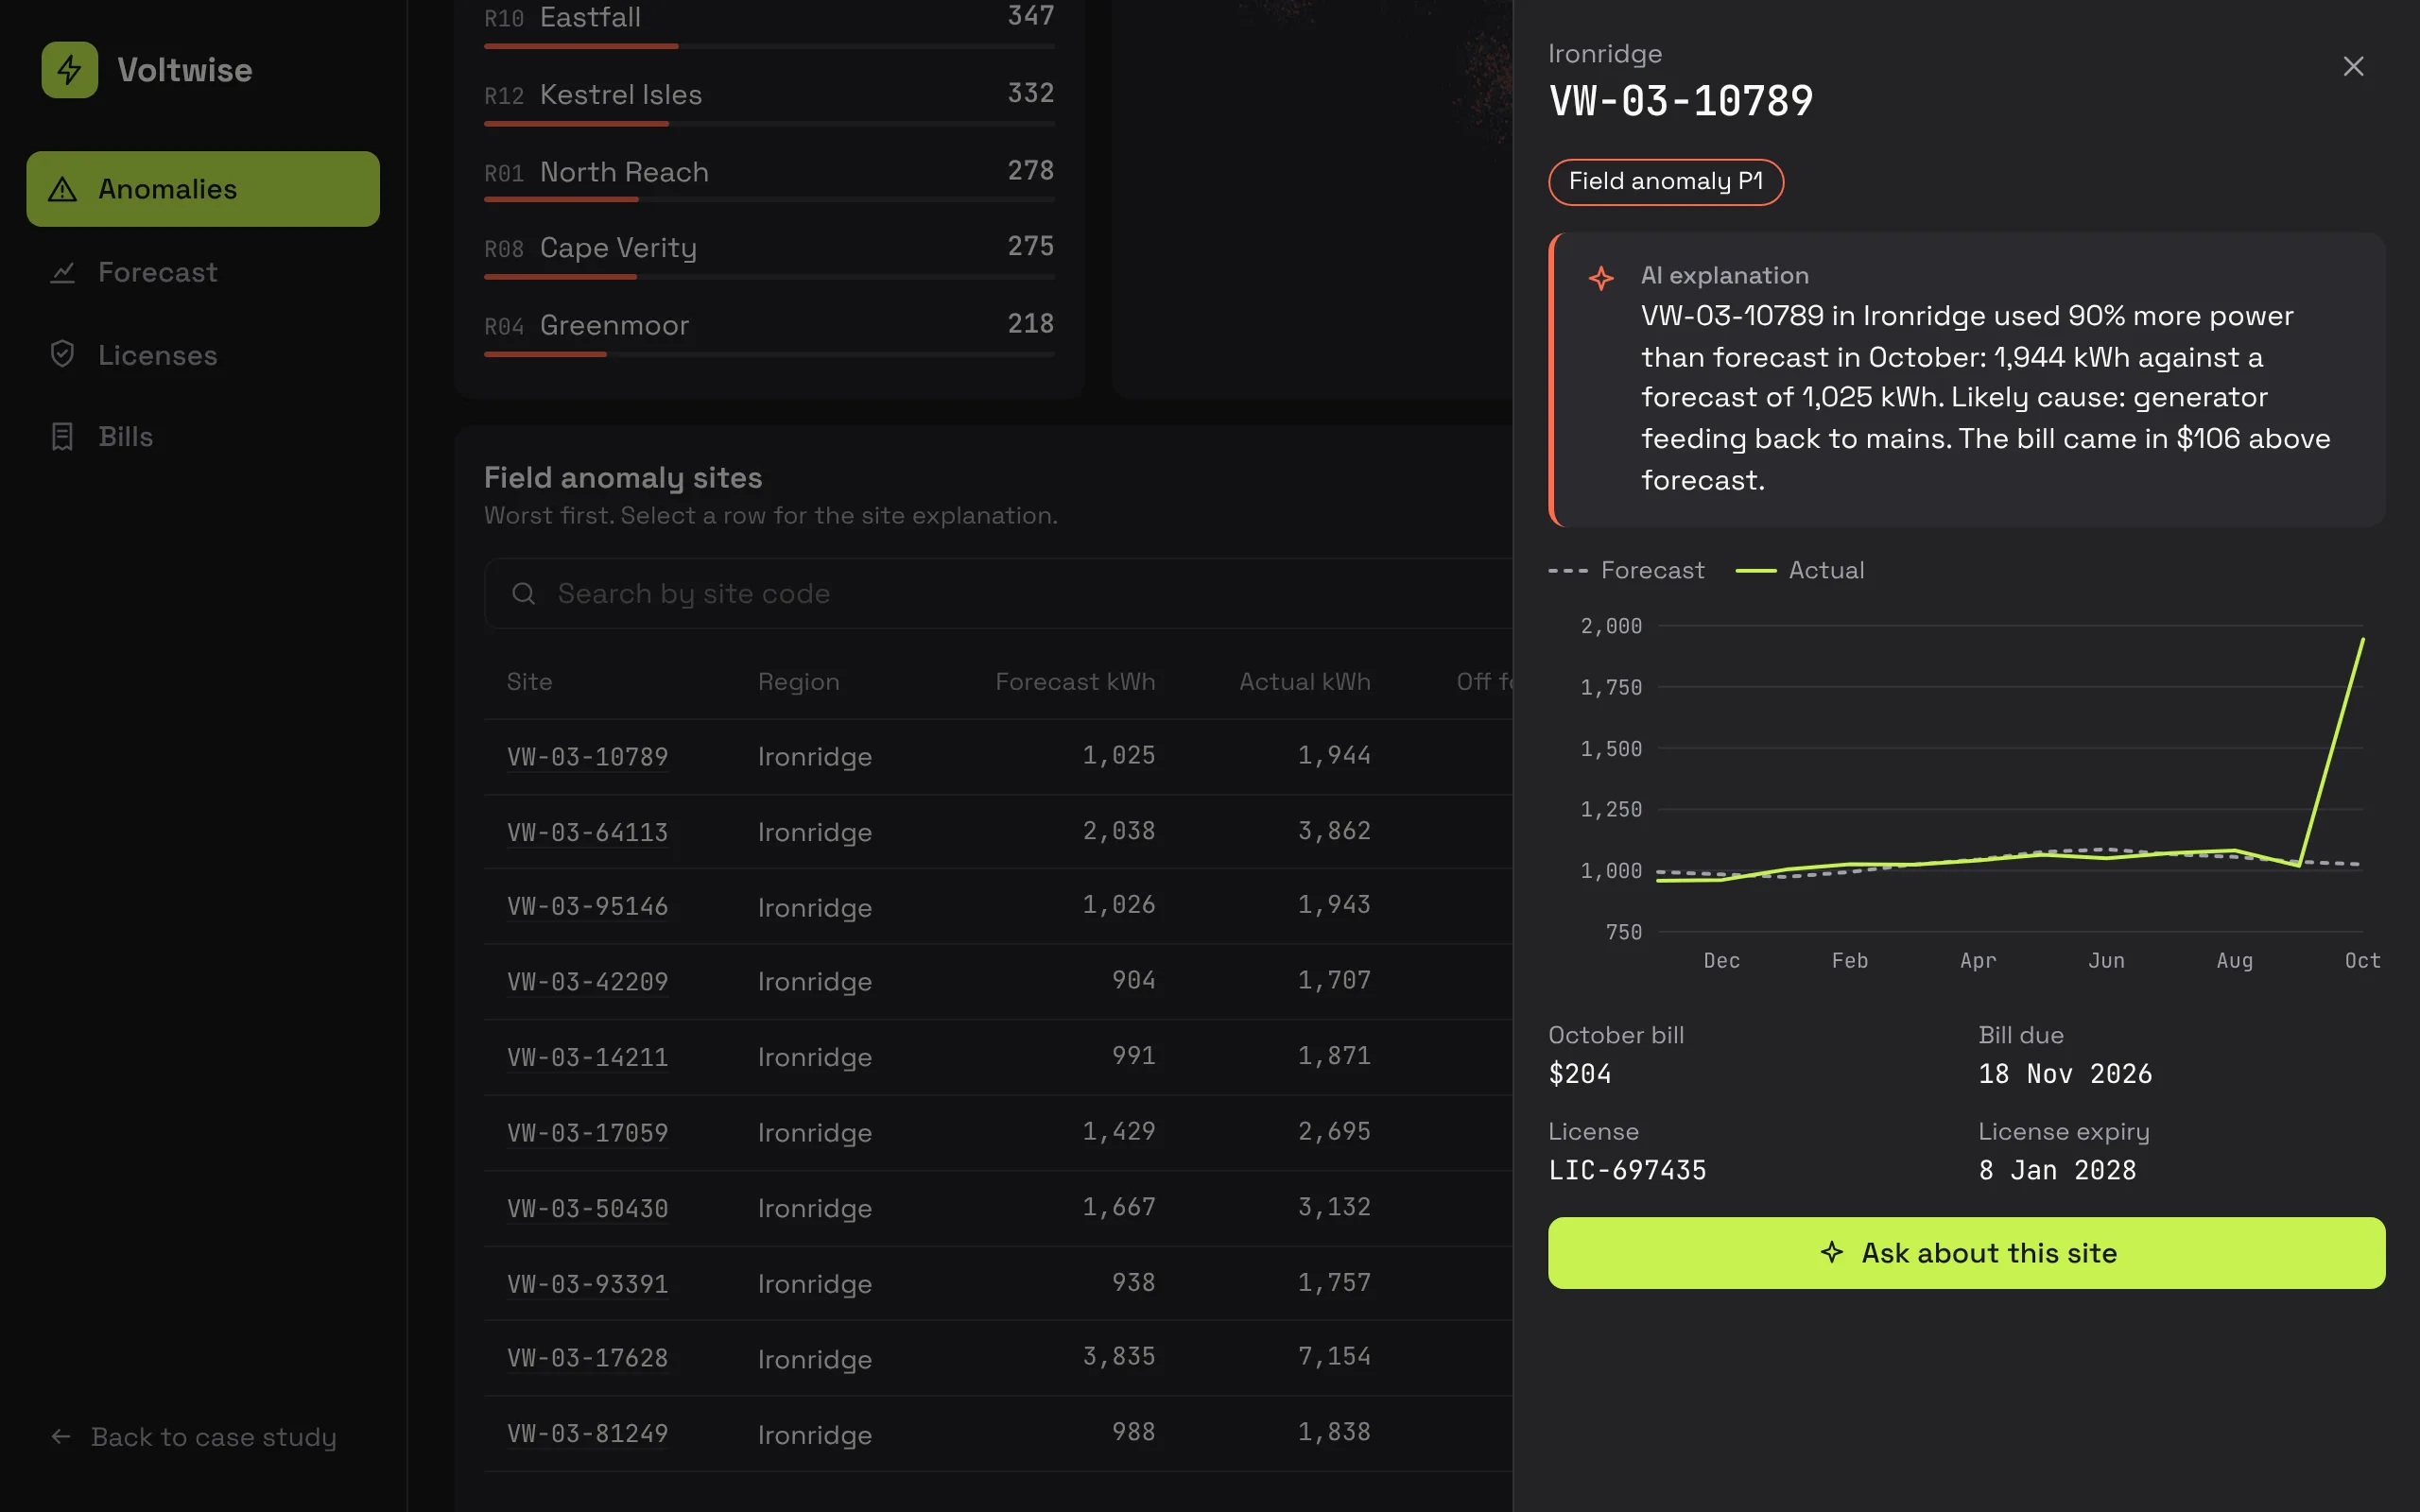
The LLM does three jobs: natural-language query, AI-generated summaries and anomaly explanations. Users can ask a question from any page without leaving the data in front of them, and answers come back as structured site results rather than a wall of text. Summaries and explanations appear where the decision happens, so nobody has to go to a separate AI page to get value from it.
where it stands
The product is pre-launch, so I do not have adoption numbers to show. What I can say is that the HQ team has reviewed the design and confirmed it works for them.